Use a map or illustration to show the extent of your content ecosystem.
Your map will show how complex the ecosystem is and should point to any channel duplication. The map should only include channels. Leave actual content for the content audit stage.
Create a picture of the content ecosystem
Content ecosystems can be very complex. The clearest way to show complexity is with pictures rather than words. You can choose from a range of visual tools to show the ecosystem.
Mind maps
Mind maps are simple and quick and will show channel complexity and duplication.
Starting with your list of channels, draw a mind map. Draw lines to show the connections between channels.
This will show the state of your content ecosystem.
Complex ecosystem map
If your map shows channel duplication or an overly complex ecosystem, you need a content strategy.

This complex ecosystem map shows the main website at the centre, surrounded by four content channel types, websites, email newsletters, social media, and apps. The channels are interconnected in a complicated and confusing way, and there are many subsets with duplicate channels.
Clear ecosystem map
A good channel ecosystem has few channels and little duplication.
The ecosystem is clear and simple.

This clear ecosystem map shows the main website at the centre, surrounded by four content channel types, websites, email newsletters, apps, and social media. There are just one or two subsets connected in a clear and simple way.
Venn diagrams
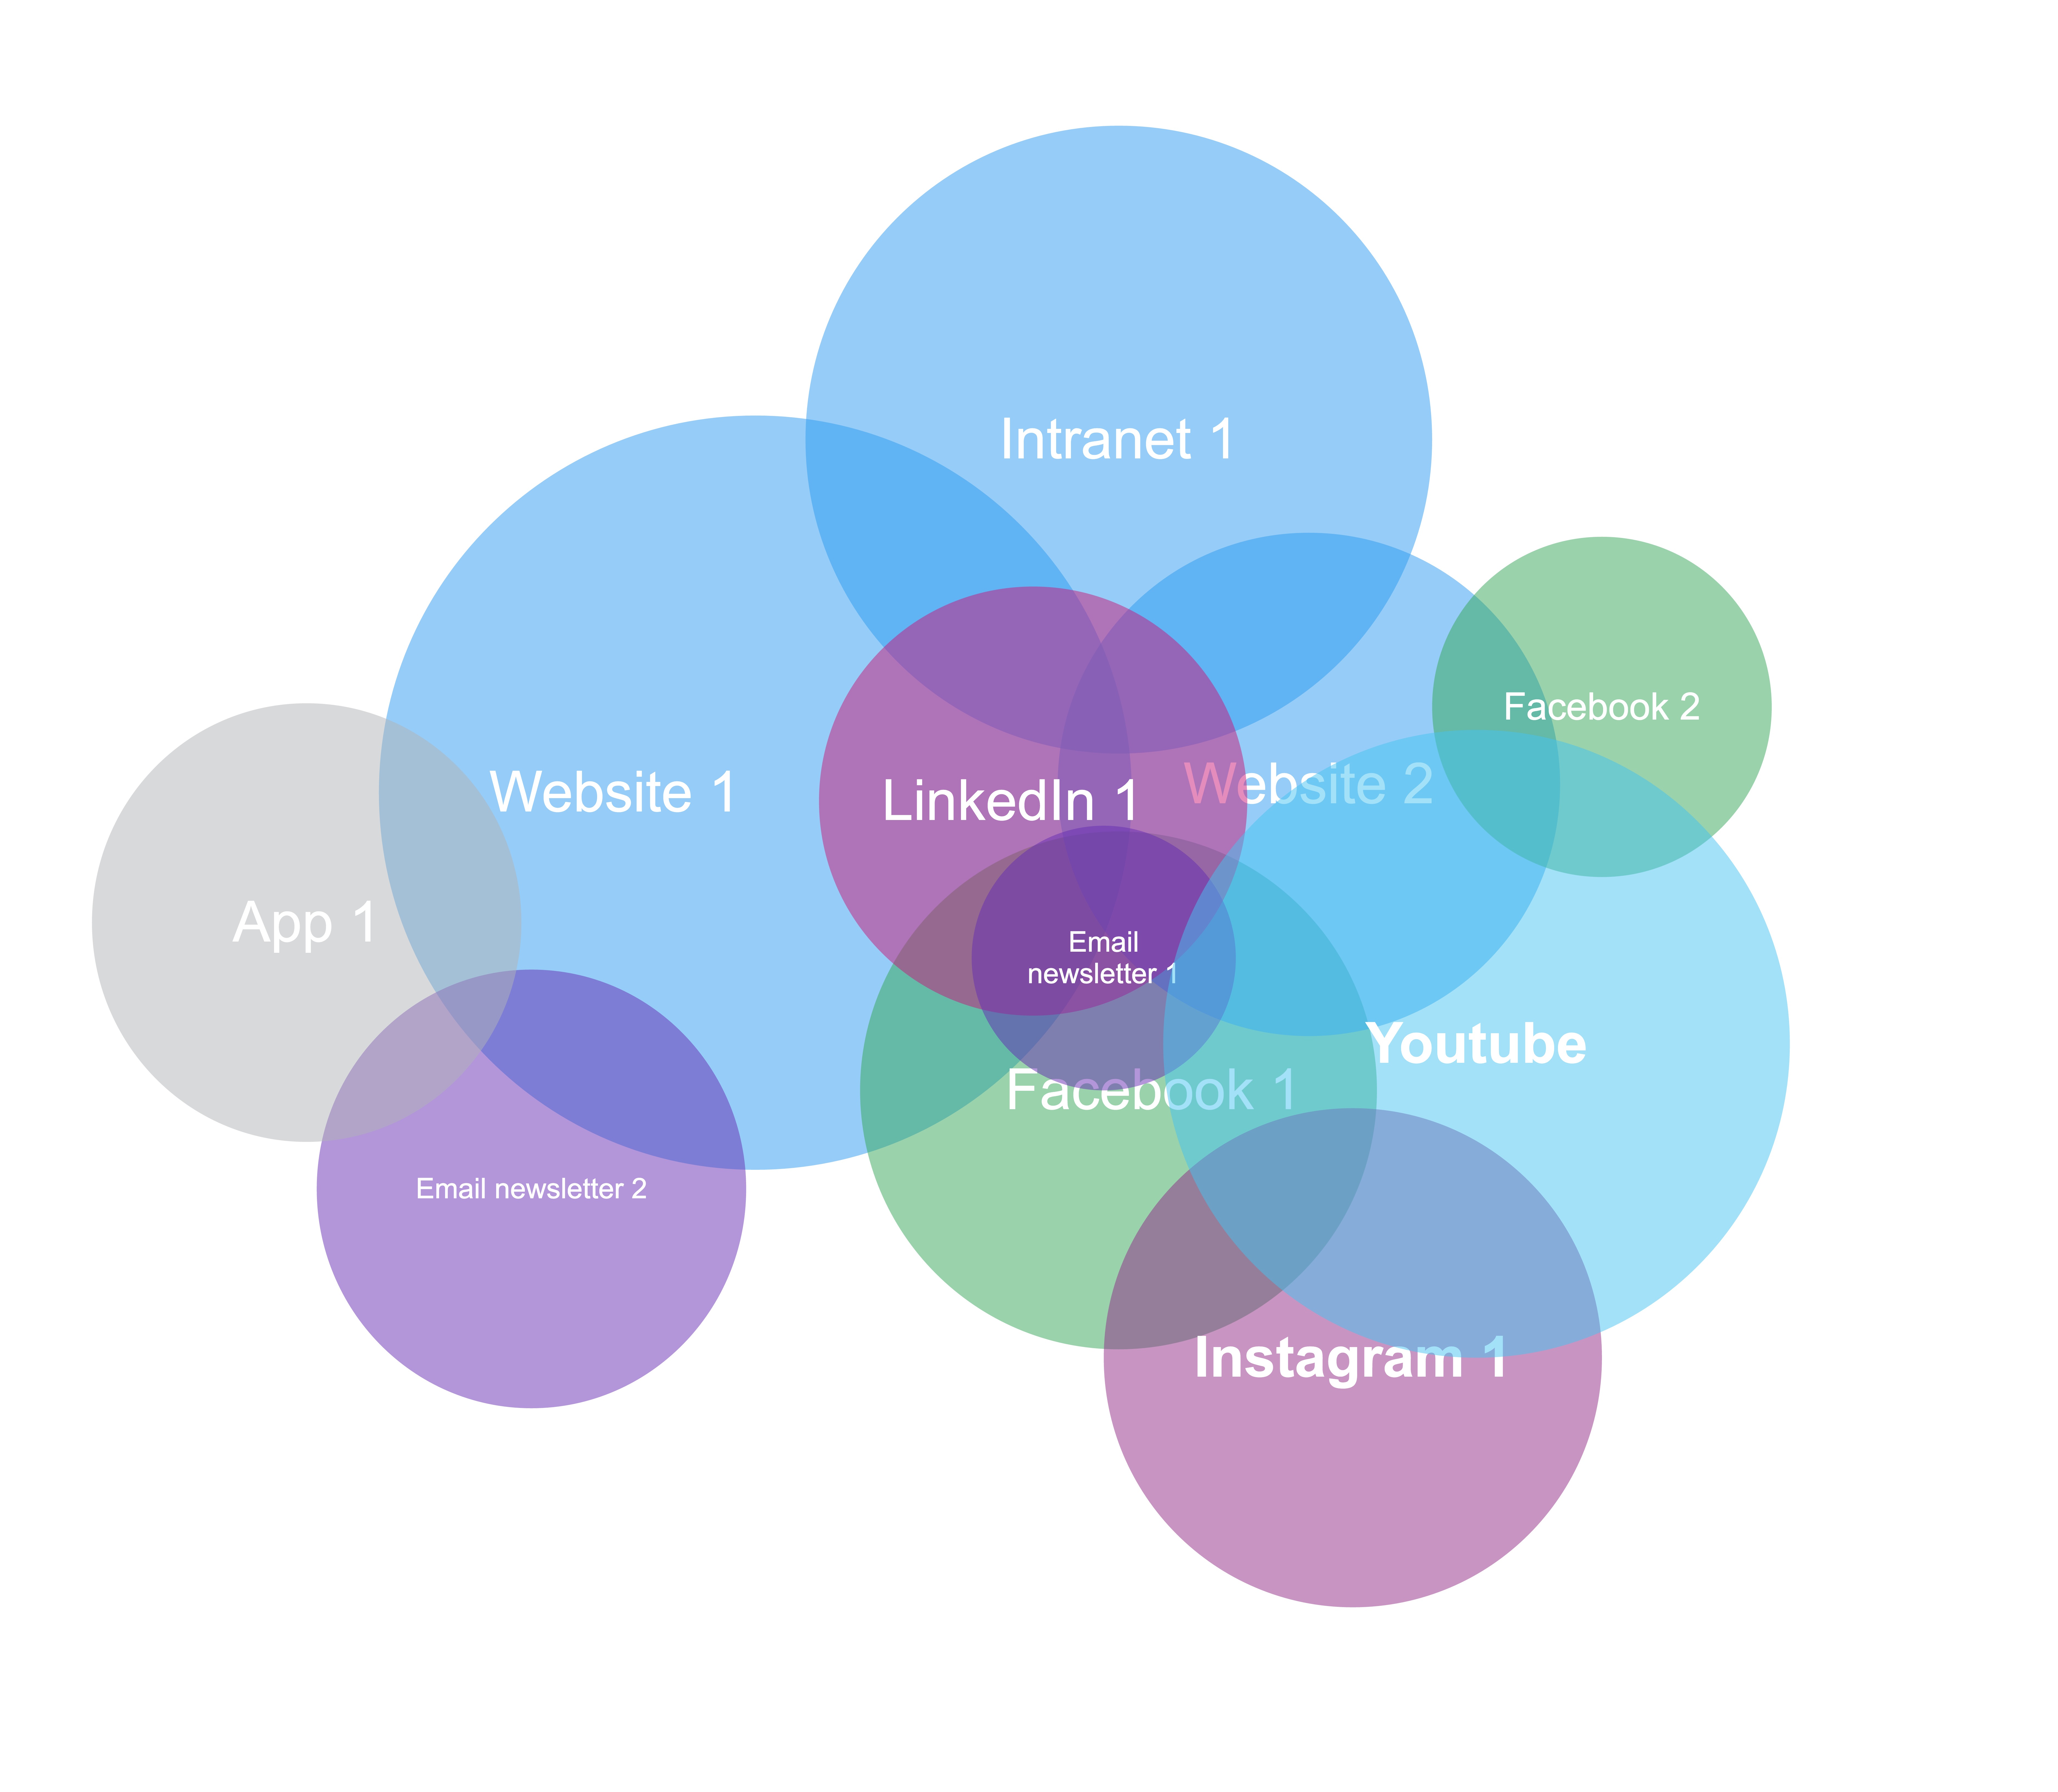
Venn diagrams are really useful for conveying overlap.
They can clearly show problems like multiple websites or departments producing the same content.

This Venn diagram is made up of circles of different sizes representing content channels. Some of the circles are overlapping, indicating that they might be producing duplicate content.
Screenshots
You can create a montage using screenshots of web pages and other channels to show duplicate channels. This is a simple, clear and fast way to present a complex content ecosystem.
